
- Separation principle: Keep inputs, calculations, and outputs in clearly separated places so anyone can change assumptions without touching formulas.
- Flow and consistency: Make logic read left to right, top to bottom, with formulas usually pointing up or left, then copy the same formula pattern across periods to spot errors fast.
- Formatting standards: Use simple conventions like blue for inputs, black for formulas, green for linked data, and red for flags so the model is readable at a glance.
- Formula discipline: Use cell references (not hardcoded numbers), break complex logic into steps, prefer sturdy lookups (like INDEX/MATCH), and bake in visible checks (balance tests, cash reconciliation).
- Professional structure and growth: Build modular sheets, plan for easy time-extension and scenario switching, document the model for handoff, and improve by recreating and reviewing real models on purpose.
The Professional Modeling Standard
Strong financial modeling skills separate technically proficient finance professionals from those who merely know Excel functions. Anyone can calculate numbers in spreadsheets – the difference lies in building models others can understand, audit, and modify without extensive reverse-engineering. Professional models follow consistent formatting conventions, logical structure principles, and transparent calculation methods that enable collaboration and reduce error risk.
The challenge is that most finance professionals learn modeling through trial and error or by copying colleagues’ approaches, absorbing both good practices and bad habits simultaneously. Without exposure to professional excel modeling best practices, you might build functionally correct models that nonetheless violate industry standards – using hardcoded values buried in formulas, inconsistent formatting that obscures logic flow, or circular references requiring manual iteration.
This guide establishes the foundational modeling principles used across investment banking, corporate finance, private equity, and financial planning roles. You’ll learn clean formatting standards that make models readable, structural design principles that enable scalability, formula construction techniques that ensure accuracy, and error-checking approaches that catch mistakes before they impact decisions.
Core Modeling Principles
Professional financial models adhere to fundamental principles that prioritize clarity, accuracy, and usability over individual convenience or aesthetic preferences.
The Separation Principle
Never hardcode assumptions directly into formulas. Separate inputs from calculations from outputs. This principle enables sensitivity analysis, scenario testing, and assumption modification without formula editing.
| Model Component | Purpose | Location & Formatting |
|---|---|---|
| Inputs/Assumptions | User-controlled variables driving model calculations | Separate sheet or top section, blue font, clearly labeled |
| Calculations | Formulas transforming inputs into outputs | Black font, cell references only, no hardcoded values |
| Outputs/Results | Final metrics, summaries, key findings | Clearly marked section, often with visual formatting emphasis |
| Source data | Historical financials, external data feeds | Separate sheet, green font or shading, date-stamped |
Never write formulas like =1000*1.05 where 1000 is revenue and 1.05 is growth assumption. Instead, reference cells: =B10*B15 where B10 contains revenue and B15 contains the 1.05 growth factor.
The Flow Principle
Model logic should flow left-to-right and top-to-bottom, matching natural reading direction. This organization allows users to follow calculation sequences intuitively without jumping randomly across the spreadsheet.
- ⏩ Horizontal flow: Time periods progress left to right (2023, 2024, 2025…)
- ⬇️ Vertical flow: Calculations build from top to bottom (revenue → COGS → gross profit…)
- 📍 Precedent clarity: Formulas reference cells above or to the left, avoiding backward references
- 🔄 Circular avoidance: Eliminate circular references; restructure logic if necessary
Expert advice: Professional modelers follow strict conventions about formula direction because it dramatically reduces error risk. When every formula references cells above or to the left, you can audit models systematically from top-left to bottom-right. Random references across distant cells create hidden dependencies that cause mysterious errors when assumptions change.
The Consistency Principle
Use identical formulas across rows whenever possible. If your revenue growth formula works for 2024, copy it across all projection years. Consistency enables quick error detection – if one column’s formula differs from others without clear reason, it’s likely a mistake.
Professional Formatting Standards
Consistent spreadsheet formatting standards transform confusing spreadsheets into professional financial models that communicate clearly and inspire confidence.
Color Coding Convention
Industry-standard color conventions signal cell purpose instantly, allowing users to distinguish inputs from calculations without reading every formula.
| Font Color | Cell Type | Editing Permission | Example |
|---|---|---|---|
| Blue | Hard-coded inputs/assumptions | Users should modify these | Revenue growth rate: 5% |
| Black | Formulas/calculations | Do not modify – formulas only | =B10*B15 (revenue calculation) |
| Green | External links/source data | Linked from other sheets/files | =Data!B10 (actual financials) |
| Red | Alerts/warnings/errors | Flagged for review | Assumption exceeds industry norms |
Visual Hierarchy and Readability
Use formatting strategically to guide users through model structure without overwhelming with excessive colors or borders.
- Bold headers for section titles and key line items
- Single underlines for subtotals, double underlines for totals
- Shading to distinguish input sections or highlight outputs
- Borders to separate major sections or time periods
- Consistent number formatting (thousands separator, decimal places, percentages)
💡 Pro tip: Apply number formatting through cell formatting rather than manual typing. Format revenue as #,##0 not typing “1,000” manually. This ensures calculations work correctly and maintains consistency when values change. Manual typing destroys formula capability and creates text values that can’t be calculated.
Layout and Structure
Organize model components logically to facilitate navigation and reduce errors caused by confusion about where information resides.
| Sheet/Section | Contents | Best Practices |
|---|---|---|
| Executive Summary | Key outputs, decision metrics, high-level findings | First sheet, stand-alone comprehension, links to detail |
| Assumptions | All user inputs, growth rates, operational metrics | Grouped logically, clearly labeled, documented sources |
| Historical Financials | Actual financial statements from filings | Source-referenced, dated, formatted consistently with projections |
| Projection Schedules | Supporting calculations feeding main statements | Separate sheets for complex items (depreciation, debt schedule) |
| Financial Statements | Income statement, balance sheet, cash flow | Three-statement integration, error checks visible |
| Valuation/Outputs | DCF, returns analysis, sensitivity tables | Clearly linked to statements, assumptions transparent |
Formula Construction Best Practices
How you write formulas matters as much as what they calculate. Clean formula construction prevents errors, enables auditing, and allows others to understand your logic.
Formula Writing Principles
Follow these guidelines when constructing any formula in a professional financial model.
- 📌 Use cell references, never hardcoded values: =B10*B15 not =1000*1.05
- 🔗 Reference same-row cells when possible: =B10*C8 not =B10*Z99 for readability
- 📊 Use named ranges for repeated references: Define “GrowthRate” instead of referencing $B$15 everywhere
- ➕ Break complex formulas into steps: Multiple simple formulas better than one incomprehensible monster
- ⚠️ Avoid nested IFs beyond 2-3 levels: Use helper columns or CHOOSE/INDEX/MATCH instead
Essential Functions for Financial Modeling
Master these Excel functions as they form the foundation of professional financial model structure creation.
| Function Category | Key Functions | Modeling Applications |
|---|---|---|
| Logical | IF, AND, OR, IFERROR | Conditional calculations, error handling, scenario switching |
| Lookup/Reference | INDEX/MATCH, XLOOKUP, OFFSET | Dynamic referencing, pulling historical data, scenario selection |
| Date/Time | DATE, EOMONTH, YEARFRAC | Period calculations, day count conventions, timing adjustments |
| Financial | NPV, XNPV, IRR, XIRR, PMT | Valuation calculations, return metrics, debt servicing |
| Mathematical | SUM, SUMIF, SUMIFS, AVERAGE | Aggregation, conditional totaling, statistical measures |
Expert advice: Investment banking and private equity firms strongly prefer INDEX/MATCH over VLOOKUP because it’s more flexible and doesn’t break when columns are inserted. Learn INDEX/MATCH thoroughly – it’s the professional standard. XLOOKUP is newer and powerful but not yet universal across organizations due to Excel version compatibility.
Formula Auditing Techniques
Build error-checking into your models rather than hoping formulas work correctly.
- Balance checks: Assets = Liabilities + Equity every period
- Cash flow reconciliation: Beginning + change = ending cash balance
- Circular reference flags: Alert if iteration required
- Assumption limits: Warning if inputs exceed reasonable ranges
- Formula consistency checks: Verify formulas match across periods
Include visible error checks in your models, typically at the bottom or side of key sections. Use formulas like =IF(ABS(Assets-Liabilities-Equity)>0.01,"CHECK BALANCE","OK") to flag problems immediately rather than discovering errors after presenting to stakeholders.
Model Structure and Design
Well-designed model design principles make models scalable, maintainable, and resistant to errors when assumptions change or time periods extend.
Modular Architecture
Break complex models into logical modules rather than building everything on one massive sheet. Modularity reduces cognitive load and isolates errors to specific components.
| Module Type | Purpose | Design Considerations |
|---|---|---|
| Revenue build | Volume × price calculations, growth drivers | Separate sheet if multiple products/segments, link to income statement |
| Operating expenses | Fixed vs. variable cost modeling | Clear drivers (% revenue, headcount, etc.), scenario flexibility |
| Working capital | Days calculations, seasonal patterns | Historical trends visible, assumption-driven projections |
| Fixed assets/Depreciation | Capex planning, depreciation schedules | Asset roll-forward, multiple depreciation methods if needed |
| Debt schedule | Principal, interest, covenants | Payment timing, interest rate structure, refinancing assumptions |
Time Period Scalability
Design models to extend time periods easily without breaking formulas or requiring extensive rework.
- 📅 Dynamic date references: Use DATE functions, not hardcoded “2024”
- 🔄 Copy-across formulas: Structure formulas to work when copied horizontally across years
- 📊 Relative vs. absolute references: Master $ usage for proper reference locking
- ⏭️ Terminal value handling: Separate perpetuity calculations from projection periods
Scenario and Sensitivity Analysis
Professional models enable easy scenario comparison and sensitivity testing through proper structure.
💡 Pro tip: Build scenario analysis using a simple dropdown or toggle switch that references different assumption sets, rather than saving multiple model versions. Use a Scenario cell (Base/Optimistic/Pessimistic) with INDEX or CHOOSE functions to pull different assumptions. This approach maintains one model file while enabling instant scenario switching.
| Analysis Type | Implementation Method | Use Case |
|---|---|---|
| Scenario analysis | Dropdown menu selecting assumption sets (Base/Bull/Bear) | Comparing distinct strategic alternatives or market conditions |
| Sensitivity tables | Data Table feature varying 1-2 key assumptions | Understanding output sensitivity to specific variables (WACC, growth) |
| Monte Carlo simulation | Random number generation with probability distributions | Risk analysis with multiple uncertain variables |
| Goal seek analysis | Excel Goal Seek or Solver tools | Finding required assumption values to achieve target outputs |
Common Modeling Mistakes to Avoid
Even experienced modelers fall into recurring traps that compromise model quality. Awareness of common mistakes helps you avoid them proactively.
Technical Errors
These mistakes create functional problems causing inaccurate outputs or broken calculations.
- Hardcoding values in formulas instead of cell referencing
- Inconsistent formulas across time periods (different logic in different columns)
- Circular references without proper iteration settings
- Broken external links to deleted or moved files
- Formula errors hidden by IFERROR without proper investigation
- Copy-paste errors destroying formula integrity
Structural Design Errors
These issues don’t break models immediately but create maintenance nightmares and error vulnerability.
| Mistake | Why It’s Problematic | Better Approach |
|---|---|---|
| One giant sheet with everything | Impossible to navigate, formulas reference distant cells, high error risk | Modular design with logical sheet separation |
| Assumptions scattered throughout | Can’t run scenarios, sensitivity analysis impossible, assumptions hidden | Centralized assumption sheet or section |
| No error checks or balance tests | Errors remain undetected until results seem wrong | Visible checks flagging imbalances immediately |
| Inconsistent formatting | Users can’t distinguish inputs from calculations | Standard color coding and formatting conventions |
| Hidden rows/columns with calculations | Creates “black box” sections, formulas break when unhidden | Separate supporting schedules on dedicated sheets |
Expert advice: The “works on my computer” model that breaks when anyone else opens it signals poor design. Professional models function identically regardless of who opens them, on different Excel versions, with links properly managed. Test your models by having someone else open and use them – their confusion reveals design flaws you’ve become blind to through familiarity.
Model Documentation and Handoff
Professional models include clear documentation enabling others to understand structure, modify assumptions, and maintain accuracy over time.
Essential Documentation Elements
Include these components in every professional financial model.
- 📋 Executive summary: Model purpose, key assumptions, main outputs, decision recommendations
- 📖 User instructions: Which cells to modify, how to run scenarios, where to find outputs
- 🔍 Assumption documentation: Sources for key inputs, reasoning behind estimates, sensitivity considerations
- 📊 Calculation methodology: Complex formula explanations, non-standard approaches, technical notes
- ✅ Version control: Date, author, change log for significant modifications
Making Models Presentation-Ready
Models used in client presentations or investment committees require additional polish beyond functional accuracy.
| Presentation Element | Professional Standard | Common Mistakes to Avoid |
|---|---|---|
| Chart formatting | Clean axis labels, consistent colors, clear titles, source citations | Default Excel chart colors, unlabeled axes, unclear legends |
| Output summary | Key metrics on first sheet, intuitive layout, decision-relevant information | Forcing reviewers to hunt through multiple sheets for conclusions |
| Print formatting | Proper page breaks, headers/footers, gridline settings | Formulas printing across multiple pages, broken tables |
| File organization | Logical sheet order, descriptive sheet names, hidden supporting detail | Sheet1, Sheet2 naming; critical sheets buried among supporting schedules |
For comprehensive guidance on presenting financial analysis effectively in interview contexts, explore interview preparation resources covering communication frameworks and technical presentation skills.
Developing Modeling Excellence
Financial modeling proficiency develops through practice, feedback, and deliberate skill refinement. Strong modelers continuously improve techniques rather than repeating familiar patterns indefinitely.
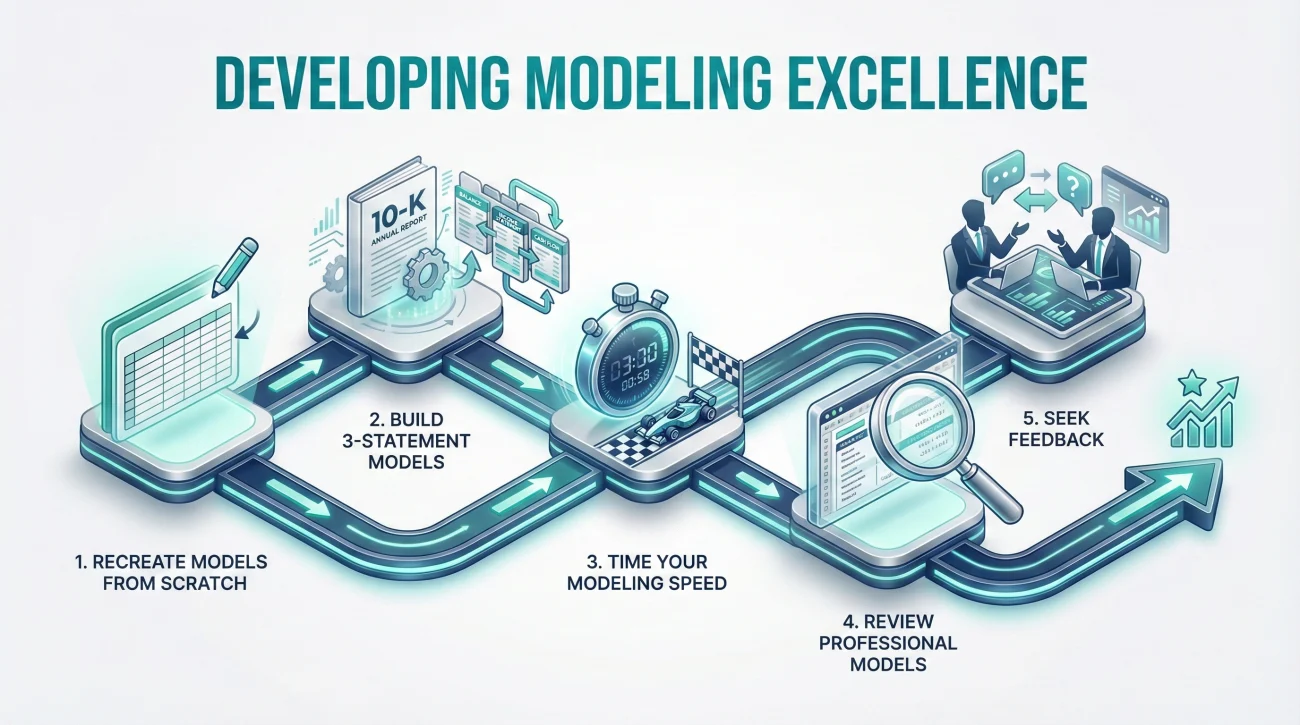
Deliberate Practice Strategies
Build modeling skills systematically through focused practice exercises.
- Recreate models from scratch based on provided outputs to reverse-engineer structure
- Build three-statement models for public companies using actual 10-K data
- Time yourself completing modeling exercises to build speed alongside accuracy
- Review professional models from reputable sources to observe design patterns
- Seek feedback on your models from experienced colleagues or mentors
💡 Pro tip: Download investor presentation models from company websites or deal documents to study how professionals structure complex financial models. Notice their formatting conventions, assumption organization, and output presentation. Recreating these models from scratch builds skills faster than theoretical study alone.
❓ FAQ
🎯 How long does it take to become proficient at financial modeling?
Basic proficiency – building simple three-statement models correctly – typically requires 2-3 months of regular practice for those with strong Excel skills. Advanced proficiency enabling complex LBO or merger models often takes 1-2 years of consistent practice. Speed and efficiency continue improving with experience. Focus on mastering fundamentals thoroughly before attempting complex modeling scenarios.
💼 Should I use Excel shortcuts or work with mouse clicks?
Professional modelers rely heavily on keyboard shortcuts for efficiency. Learn essential shortcuts like F2 (edit cell), F4 (toggle absolute/relative references), Alt + = (AutoSum), Ctrl + Arrow keys (navigate), and Alt + E + S + V (paste values). Speed matters in modeling-intensive roles where analysts build models under tight deadlines. However, accuracy always trumps speed – slow and correct beats fast and wrong.
⏰ What’s more important: model accuracy or presentation quality?
Accuracy is non-negotiable – a beautifully formatted model producing wrong answers is worthless. However, accurate models with poor formatting create errors during use because users misunderstand structure or modify wrong cells. Professional models achieve both: technical accuracy through proper formula construction and usability through clear formatting. Neither dimension alone suffices for professional standards.
📋 Should I build models from scratch or use templates?
Build foundational models from scratch to develop deep understanding of structure and formula logic. Templates are useful for standardizing formatting across organization or accelerating routine tasks, but relying on templates without understanding underlying construction prevents skill development. For interviews, you’ll often build models from scratch without template access, so practice that skill extensively.
✨ How do I handle Excel version differences across organizations?
Stick to widely compatible functions available across Excel versions unless you know target organization uses specific versions. Avoid newest functions like XLOOKUP if interviewing at organizations potentially using older Excel. Test models on different Excel versions when possible. Save files in .xlsx format for broad compatibility. Document any version-specific features used so users understand requirements.
Final Thoughts
Mastering financial modeling skills requires more than learning Excel functions or memorizing valuation formulas. Professional modeling excellence emerges from disciplined adherence to structural principles, consistent formatting standards, and transparent calculation methods that enable collaboration and reduce error risk. The difference between amateur spreadsheets and professional models lies not in complexity but in clarity – whether others can understand, audit, and modify your work without extensive reverse-engineering.
Strong modelers don’t just build functionally correct calculations – they design models others can use confidently. This means separating inputs from calculations consistently, following logical flow principles that match natural reading patterns, applying industry-standard color coding that signals cell purpose instantly, and constructing formulas that remain transparent rather than obscure. These disciplines transform modeling from individual technical exercise into professional communication tool.
Before your next modeling task or interview, review core principles governing input separation, flow logic, and formula construction. Practice building models that balance technical accuracy with usability, ensuring calculations work correctly while remaining comprehensible to others. Develop systematic error-checking habits rather than hoping formulas work properly. This structured approach builds genuine modeling competence that serves you throughout your finance career, not just superficial familiarity sufficient for passing interviews.
⚠️ Disclaimer: The interview strategies, sample answers, and negotiation tips provided in this guide are for educational purposes only. Hiring decisions are subjective and vary by company and industry. While these strategies are based on professional HR standards, they do not guarantee a specific job offer or result.